
Construction Data Services
A joined-up system for construction reporting confidence
Bluestone Analytics connects Vista ERP and your wider operational systems through a governed Microsoft Fabric data foundation - delivering more dependable WIP, forecasting, margin and executive reporting.
Reporting problems are system problems
Unreliable construction reporting is rarely just a dashboard problem. It usually begins with disconnected systems, inconsistent definitions, manual spreadsheet processes and data that arrives too late to support confident decisions.
We address the underlying data foundation first, connecting systems, governing commercial logic and creating a dependable source of truth.
COMMERCIAL OUTCOMES
Better data. Better commercial decisions.
A connected reporting foundation gives construction teams earlier visibility, greater confidence and less reliance on manual processes.
Trusted WIP reporting
Create a consistent view of work in progress so finance, commercial and operational teams work from the same governed numbers.
Connect project and financial information to improve forward visibility of receipts, payments and funding requirements.
Stronger cash-flow forecasting
Give leadership one governed view of performance across projects, divisions and reporting periods.
Consistent executive reporting
Earlier margin visibility
Bring cost, revenue, commitments and progress together to identify margin movement before it becomes a month-end surprise.
Less spreadsheet reconciliation
Reduce repeated exports, file consolidation and version checking so teams can spend more time analysing the business.
A foundation that scales
Build a secure platform that can accommodate new systems, projects, dashboards and analytical requirements over time.
The capabilities that make it possible.
core capabilities
From data strategy and platform implementation to reporting and automation, we connect your systems, strengthen your data foundation, and deliver the commercial insight your business needs.
Click any service to view key deliverables and expected business impact.
We help construction companies define a practical data strategy aligned with their operational priorities, reporting requirements, and long-term business goals.
What we deliver
Current-state data and reporting assessment
Data strategy, architecture, and implementation roadmap
Governance standards and consistent metric definitions
business value
A clear, prioritized plan for improving reporting, reducing data inconsistency, and investing in the right technology.
We design and implement governed Microsoft Fabric environments that bring operational and financial data together for reporting and analytics.
What we deliver
Fabric workspace and environment configuration
Lakehouse and warehouse architecture
Security, governance, and deployment standards
business value
A secure, scalable data foundation that supports dependable reporting and future analytical requirements.
We structure and connect Viewpoint Vista ERP data so it can be used more effectively across financial, commercial, operational, and executive reporting.
What we deliver
Vista data extraction and integration
Reporting-ready models for jobs, costs, contracts, and ledgers
Historical data structures for trend and performance analysis
business value
Faster access to consistent Vista data without relying on repeated exports, disconnected spreadsheets, or complex source-system queries.
We build automated data pipelines that connect Vista ERP with Microsoft Fabric and other business systems, including estimating, CRM, payroll, and project platforms.
What we deliver
Automated data ingestion and transformation
Connections between operational source systems
Data validation, monitoring, and error handling
business value
More timely and reliable information with less manual data preparation and fewer disconnected reporting processes.
We create Power BI reporting that gives project teams and leadership a clear, governed view of commercial and operational performance.
What we deliver
Executive and financial performance dashboards
WIP, margin, cash-flow, and project reporting
Secure, role-based access for different teams and stakeholders
business value
Clearer visibility of performance, emerging risks, and commercial trends across projects and the wider business.
We automate repetitive reporting and data-management tasks to reduce manual effort and improve the consistency of business processes.
What we deliver
Automated report preparation and distribution
Alerts for exceptions, reporting issues, and commercial risks
Workflow integration using Microsoft tools and connected systems
Less time spent preparing and reconciling information, allowing teams to focus on analysis, action, and decision-making.
business value

reporting in practice
See the Whole Business.
Not Just Another Report.
Bring financial, commercial and operational data together in one governed reporting experience. From executive performance to project-level detail, decision-makers can explore the numbers that matter without relying on disconnected spreadsheets.
See where project margin is moving
CONSTRUCTION PERFORMANCE
Track earned revenue, forecast costs, gross profit, backlog and billings across the project portfolio. This demonstration shows how commercial teams can identify margin movement and investigate performance at project level.

FINANCIAL PERFORMANCE
See actual and budget performance in one view
Compare income, direct costs and operating expenses against budget across each reporting period. This demonstration shows how leadership teams can identify variances, understand monthly trends and investigate financial performance without reconciling multiple spreadsheets.
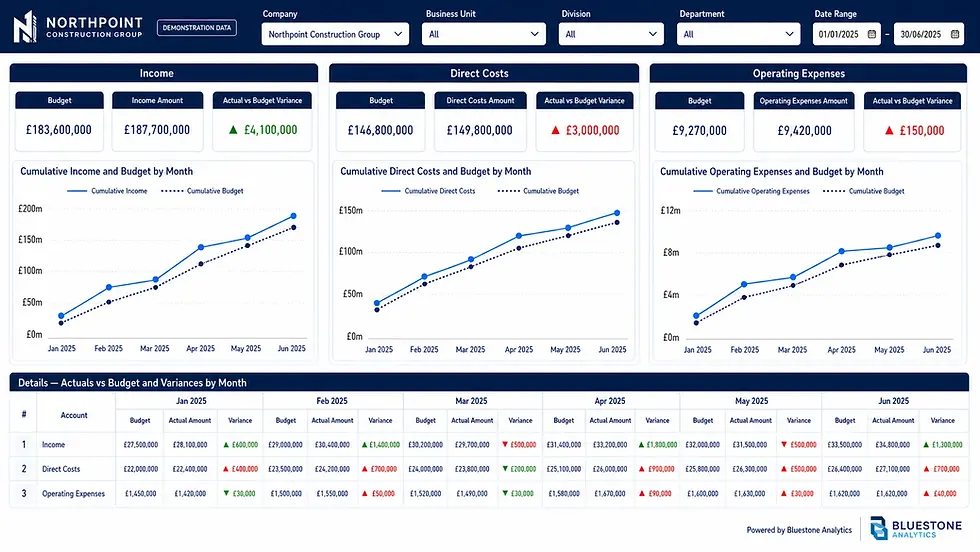
Illustrative dashboard using fictional company information and demonstration data.
Turn working-capital data into clearer action
FINANCIAL VISIBILITY
Bring receivables, payables, cash and billing positions into one view. Monitor collection and payment trends, understand liquidity, and identify changes that may require commercial attention.

Illustrative dashboard using fictional company information and demonstration data.
Understand the shape of your workforce
WORKFORCE ANALYTICS
Explore headcount, employment type, payroll classification, workforce demographics, tenure and organizational distribution through one governed reporting experience.
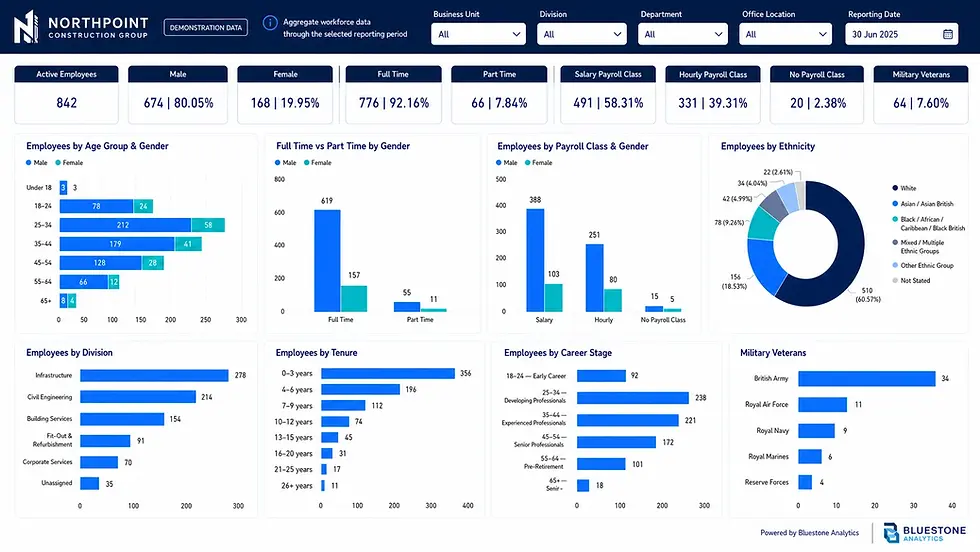
Illustrative dashboard using fictional company information and demonstration data.
Illustrative dashboard using fictional company information and demonstration data.